Salton Sea H₂S CNN
python, supercomputing, jupyter, deep learning
This summer, I’m working with Dr. Mara Freilich and Alejandra Lopez (Brown University) and the Salton Sea Environmental Timeseries Project to hindcast hydrogen sulfide (H₂S) emissions using satellite imagery of the Salton Sea in southern California.

Background
The Salton Sea is California’s largest lake and a major environmental and public health concern. As the lake has shrunk over decades, exposed lakebed and stagnant water have contributed to harmful air quality events — including periodic spikes in hydrogen sulfide, a toxic gas with well-documented health impacts on the surrounding Coachella Valley communities. Monitoring these emissions is difficult: ground-level sensors only capture H₂S under specific conditions, leaving substantial gaps in the historical record.
Others in my lab had previously developed machine learning models that classify individual days as high- or low-emission events using these sensor readings, but coverage was limited to certain wind conditions. My role is to extend this work by training convolutional neural networks (CNNs) on multispectral satellite imagery as a spatial proxy for H₂S, enabling hindcasting across more dates.
Data Pipeline
I built an end-to-end pipeline that processes raw multispectral satellite imagery through cloud masking, area-of-interest clipping, and band stacking into analysis-ready arrays covering the full Salton Sea at high spatial resolution. Labels are assigned by joining satellite dates with H₂S sensor readings, using a threshold to define high-emission events.
Model
The core model is a lightweight CNN designed to operate on the full spatial extent of the Salton Sea across four spectral bands. It was trained on Brown’s supercomputer Oscar using PyTorch, with chronologically structured train/val/test splits.
Results
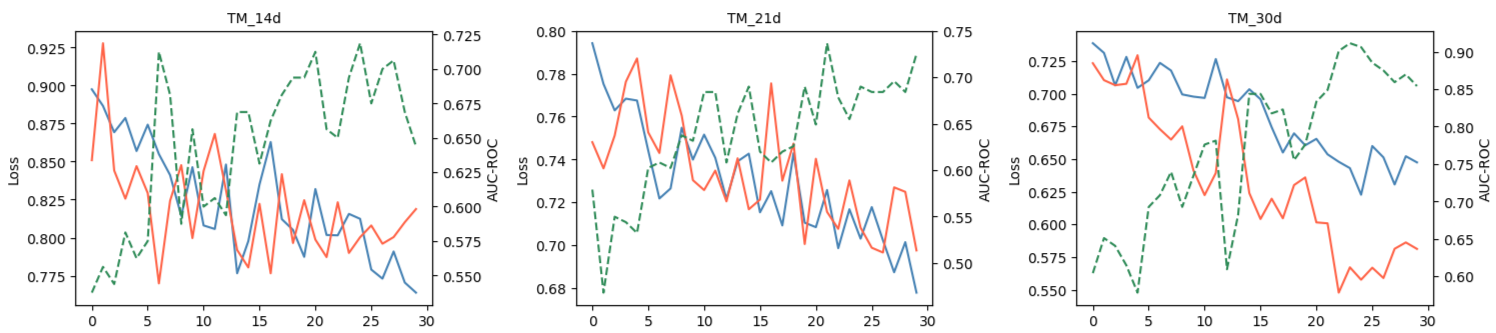
The best-performing models suggest that surface conditions visible from space are meaningfully predictive of H₂S events in the days that follow. Performance was evaluated using AUC-ROC on a held-out chronological test set.
Interpretability: Saliency Maps
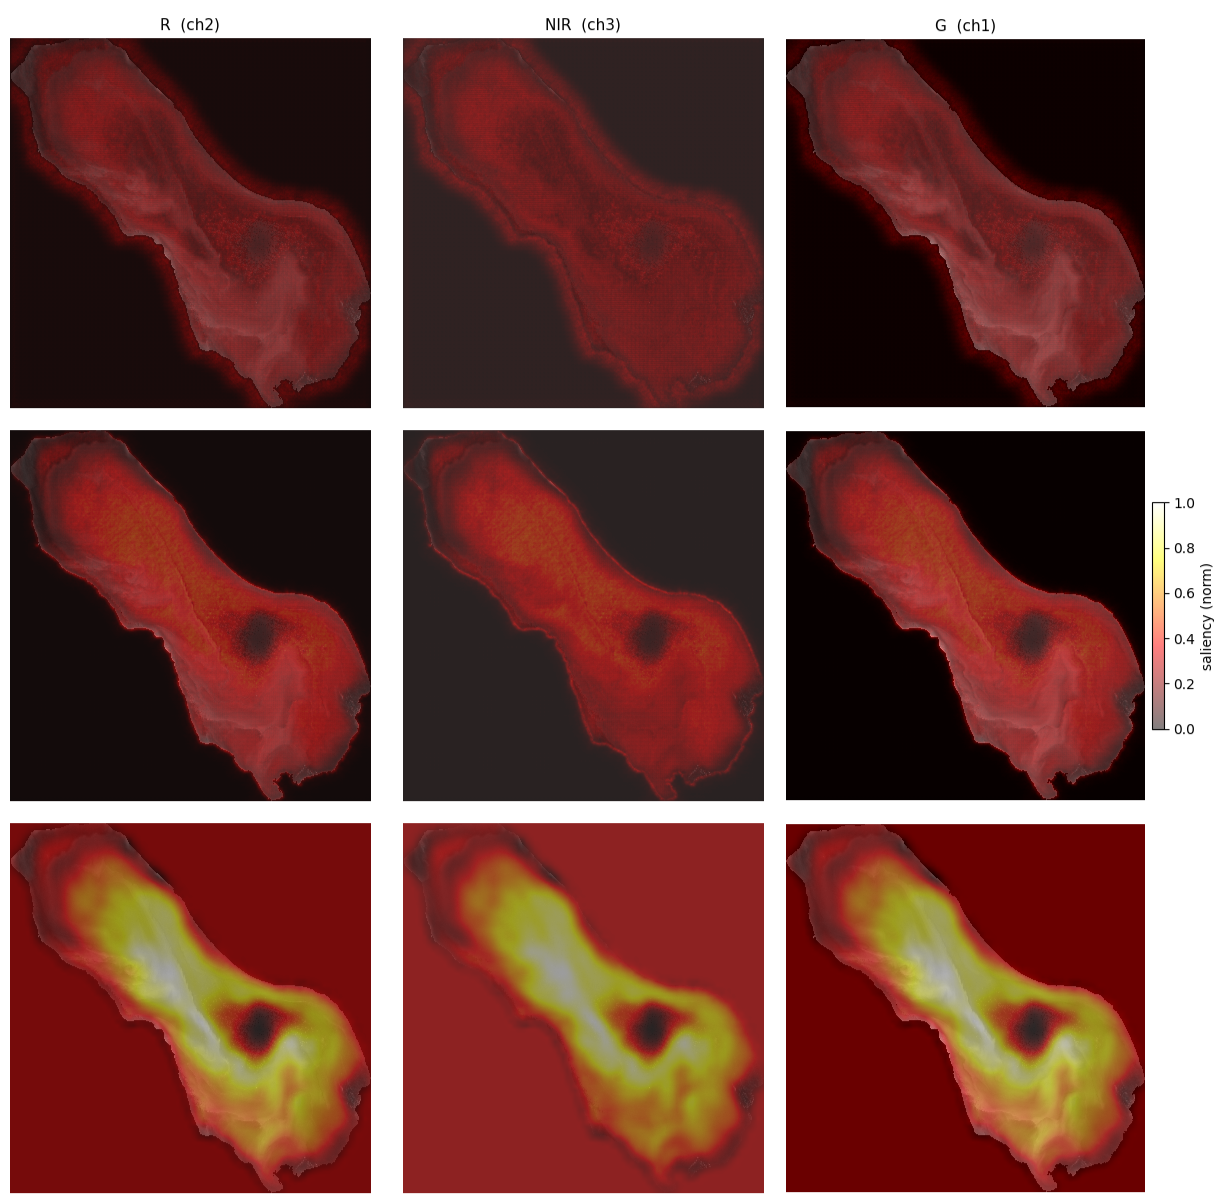
A key component of this work is understanding where in the satellite image the model is looking. I computed multiple types of saliency maps (vanilla, guided, gradcam) for positive test samples to investigate which physical features of the lake surface drive predictions.
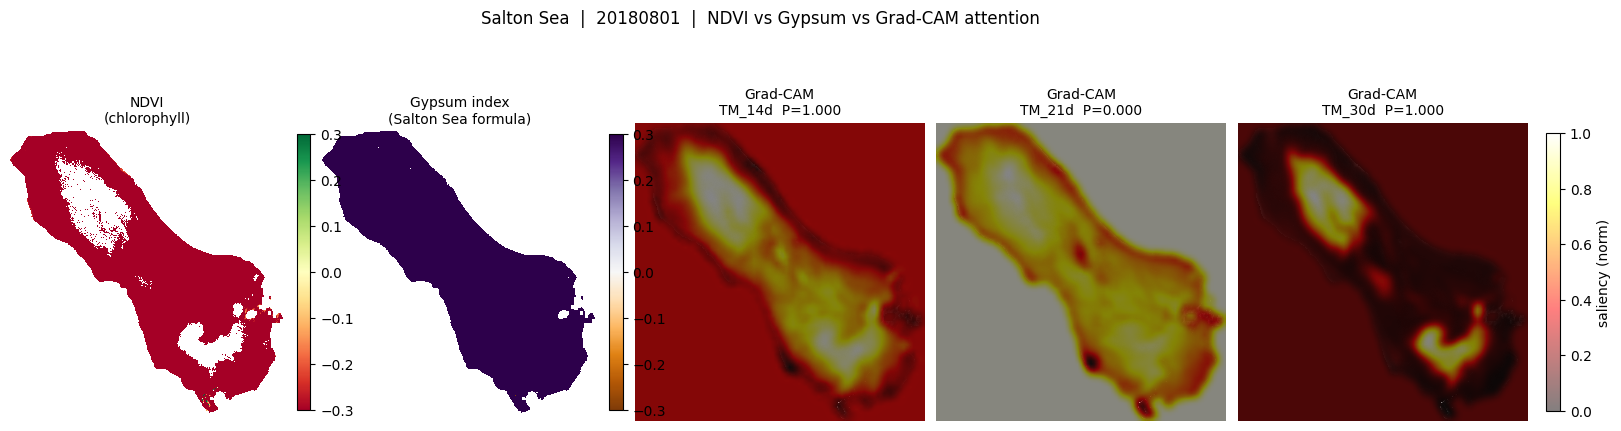
I also compared saliency hotspots against domain-specific spectral indices to probe what physical signal the model may be attending to — connecting model behavior back to hypotheses about H₂S precursors in the lake.
What’s Next
Current efforts are focused on further optimizing model performance and refining predictions to be more actionable for community partners. This project represents my first end-to-end deep learning pipeline — from raw satellite data through model training, evaluation, and spatial interpretability — and I’m proud of how much ground it has covered.